Documentation
Alerting
It works for IBM Power Systems, Oracle Database and Linuxes which have installed OS agent only.
You can define alarms based on performance data for CPU pool, LPAR, VM in your environment.
This is valid only if you use HMC CLI (ssh) access, HMC REST API does not need it.
There is no any specific setup in the tool, it uses setting on the operating system.
In case of problems
You can define alarms based on performance data for CPU pool, LPAR, VM in your environment.
Metrics: IBM Power System
| object | metric | value | data source | Note |
|---|---|---|---|---|
| ALL servers | Paging | MB/sec | OS agent | |
| server | CPU | CPU core or % | HMC | IBM Power only |
| CPU POOL | CPU | CPU core or % | HMC | IBM Power only |
| LPAR | CPU | CPU core or % | HMC | IBM Power only |
| LPAR | CPU OS | % | OS agent | |
| LPAR | Memory used | % | OS agent | |
| LPAR | Paging | MB/sec | OS agent | |
| LPAR | Paging allocation | % | OS agent | |
| LPAR | LAN | MB/sec | OS agent | |
| LPAR | SAN | MB/sec | OS agent | |
| LPAR | SAN | IOPS | OS agent | |
| LPAR | SAN response time | mili seconds | OS agent | |
| LPAR | Filesystem usage | % | OS agent |
Metrics: Linux with the OS agent
| object | metric | value | data source | Note |
|---|---|---|---|---|
| VM | CPU OS | % | OS agent | |
| VM | Memory used | % | OS agent | |
| VM | Paging | MB/sec | OS agent | |
| VM | Paging allocation | % | OS agent | |
| VM | LAN | MB/sec | OS agent | |
| VM | SAN | MB/sec | OS agent | |
| VM | SAN | IOPS | OS agent | |
| VM | SAN response time | mili seconds | OS agent | |
| VM | Filesystem usage | % | OS agent |
Metrics: Oracle Database
| object | metric | value |
|---|---|---|
| Database | Current logons count | number |
Alerting possibilities
- Emailing. You can place direct email address on each directive, use email groups or default email address.
-
Nagios support. You can configure Nagios to pick up alarms from LPAR2RRD via standard NRPE module.
LPAR2RRD Nagios plug-in installation - External alerting via external shell script. Each alert can invoke defined script with given parameters. You can use it for your integration needs.
- SNMP trap: follow this to configure it
- Alert plug-ins to other monitoring tools can be developed on demand especially for customers under support contract
Configuration
Configuration is managed through the UI ➡ Settings ➡ AlertingIBM Power Systems via CLI (ssh)
To enable HMC data based alerting place (CPU core for LPAR/POOL/POOL Total) this job into lpar2rrd's crontab:This is valid only if you use HMC CLI (ssh) access, HMC REST API does not need it.
0,10,20,30,40,50 * * * * /home/lpar2rrd/lpar2rrd/load_alert.sh > /home/lpar2rrd/lpar2rrd/load_alert.out 2>&1
Email setup
Use your company's default email setup on the operating system you run LPAR2RRD.There is no any specific setup in the tool, it uses setting on the operating system.
In case of problems
- Try send out a testing email from cmd line:
$ echo "test message"| mailx -s test your_email@company.com
- Check success in mail log /var/log/maillog (Linux), /var/log/mail (AIX)
Alerting is based on reaching of performance thresholds.
You can define alarms for any storage and its volumes, pools or host.
There is no any specific setup in the tool, it uses setting on the operating system.
In case of problems
You can define alarms for any storage and its volumes, pools or host.
Sources
- Storage total (summary of all pools)
- Pool
- Volume
- Host
Metrics
- io: IO/sec total (read + write)
- io read: IO/sec read
- io write: IO/sec write
- data: data throughput in MB/sec (read + write)
- read: read data throughput
- write: write data throughput
- resp time: response time, latency
- resp time read: response time read
- resp time write: response time write
Types
-
Emailing. You can place direct email address on each directive, use email groups or default email address.
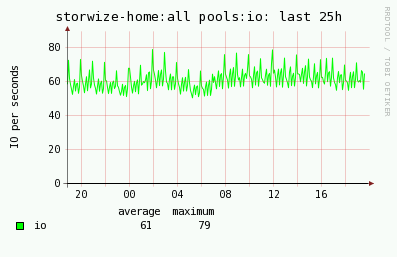
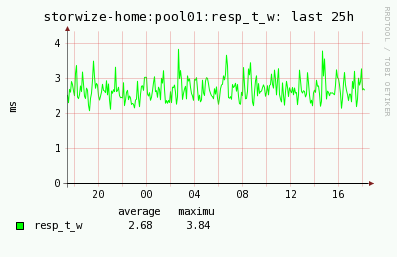
Alert email has attached graph which shows utilization of the metric for past 25 hours. -
Nagios support. You can configure Nagios to pick up alarms from STOR2RRD via standard NRPE module.
Nagios plug-in installation -
External alerting via external shell script. Each alert can invoke defined script with given parameters.
You can use it for your integration needs. - SNMP trap: follow this to configure it
- Alerting plug-ins to other monitoring tools can be developed on demand especially for customers under support contract
Configurables
- Limit: threshold level in IO per second, MB per seconds or mili seconds
- Peak: The period of time in which avg traffic utilization has to be over the specified limit to generate an alert.
-
Repeat: Default time in minutes which says how often you should be alerted.
You can specify per storage/pool/volume different value in alert repeat time column of each alert -
Exclude hours: time range in hours when alerts will be ignored
It is useful for exclusion of nightly batch jobs which usualy causing a big load. - Email group: you can create different email groups and direct alarms to them
Email setup
Use your company's default email setup on the operating system you run STOR2RRD.There is no any specific setup in the tool, it uses setting on the operating system.
In case of problems
-
Try send out a testing email from cmd line
$ echo "test message"| mailx -s test your_email@company.com
- Check succcess in mail log /var/log/maillog (Linux), /var/log/mail (AIX)
Email alert example 1
-
Alert when average write response time for storwize-home and pool01 is greater then 2.5 mili seconds during last 15 mins
Subject
STOR2RRD: POOL alert for storwize-home:pool01: response time write, actual value: 2.67 ms (limit 2.5)
STOR2RRD alert
 Time: 18:24:00 18/06/2016
 Storage: storwize-home
 POOL: pool01
 Metric: response time write
 Average response time during last 15mins: 2.67 ms
 Limit: 2.5
Email alert example 2
-
Alert when average overall IO for storage storwize-home is greater then 50 IO/sec during last 5 mins
Subject
STOR2RRD: POOL-ALL: alert for storwize-home:all pools: io, actual value: 65 IO/sec (Limit 50)
STOR2RRD alert
 Time: 19:48:00 18/06/2016
 Storage: storwize-home
 POOL-ALL: all pools
 Metric: io
 Average throughput during last 5mins: 65 IO/sec
 Limit: 50