Documentation
Dashboard
Dashboard is empty by default.It is up to users to select and place graphs into the dashboard.
Each graph has a star on its top-right, by clicking on it appears a dialog for adding the graph into the dashboard. You can create here new dashboard tabs and groups or add the graph into already existing ones.
Dashboard is fully customizable, you can:
- Create a new tab
- Create a new group
- Move graphs between groups (drag&drop)
- Resize graphs (drag&drop)
- Resize groups (drag&drop)
- Dashboards can be shared between users
- Share dashboards between users
Dashboard sharing
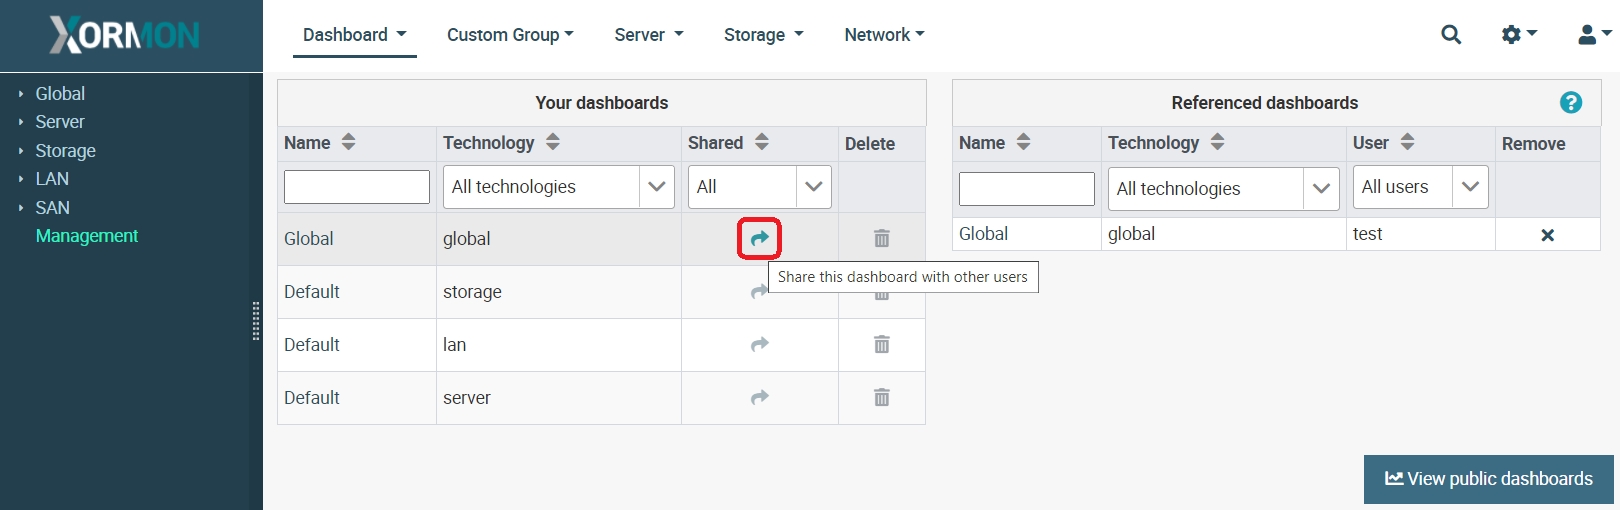
Your dashboards table contains dashboards to which you have write access.Referenced dashboards are managed by user who created them and are readonly views you have imported.
To share your dashboard with other users, click on "upward and right" arrow icon in Your dashboards table, shared dashboards are visible in View public dashboards dialog
 |
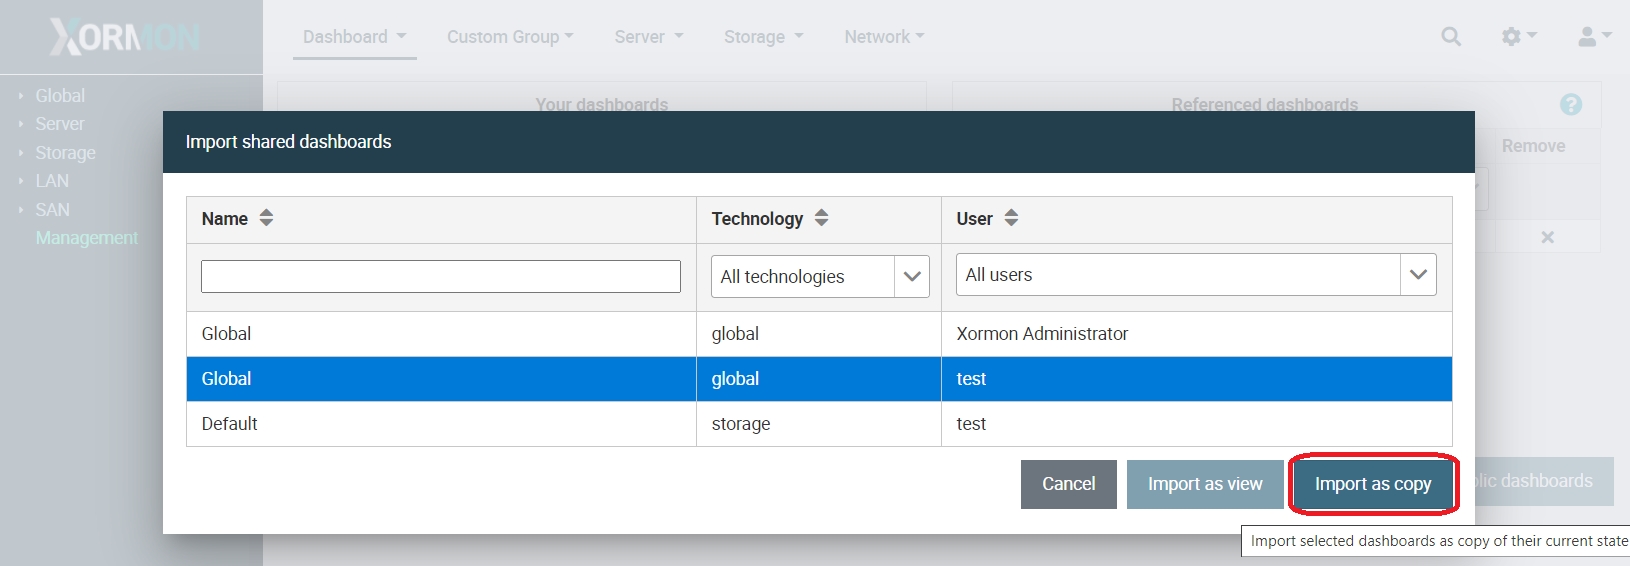
To import shared dashboard for your own modifications, choose "Import as copy" from View public dashboards dialog, imported copy will have index number appended to its name
 |
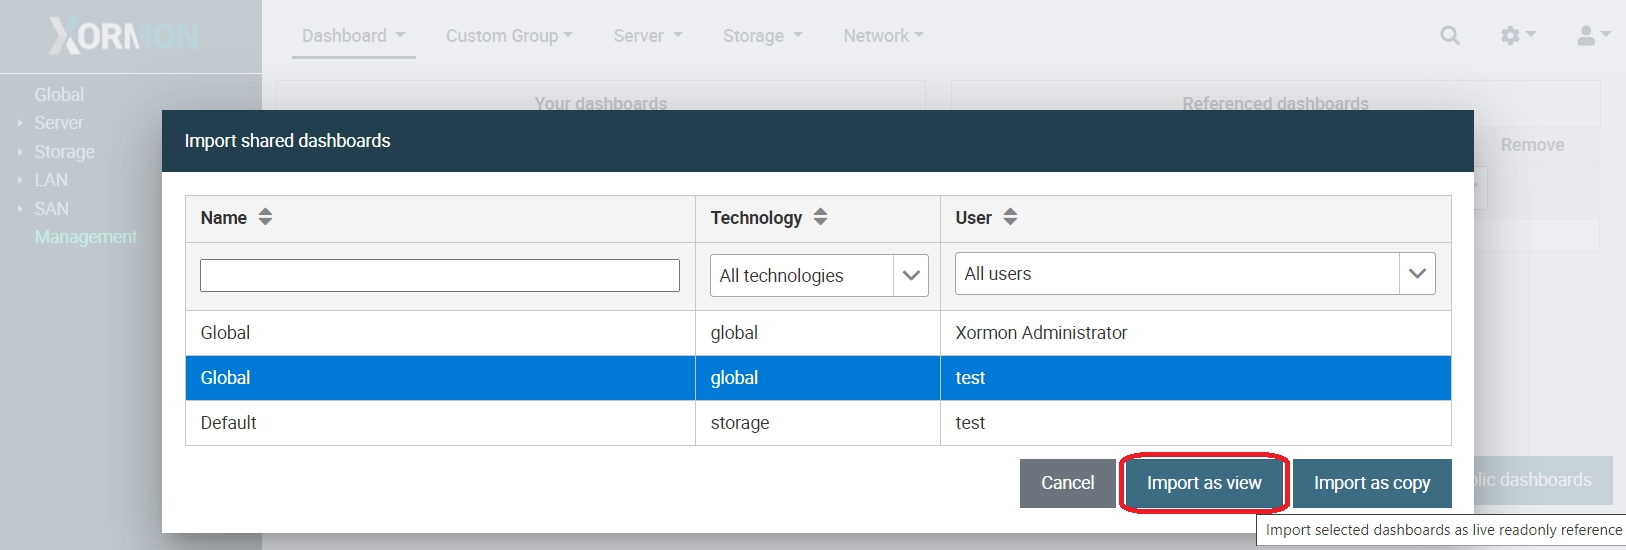
To import other's dashboard as readonly live reference, click on "Import as view" from View public dashboards dialog, imported view will have authors initials appended to its name
 |