Documentation
Custom Groups
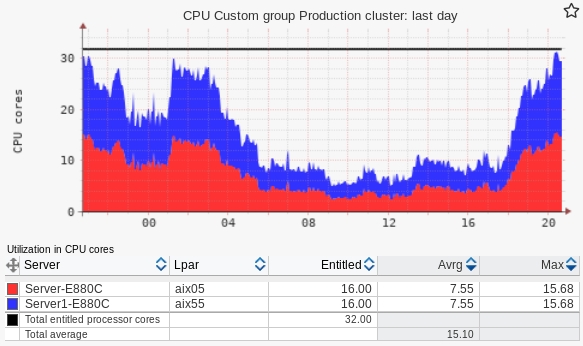 |
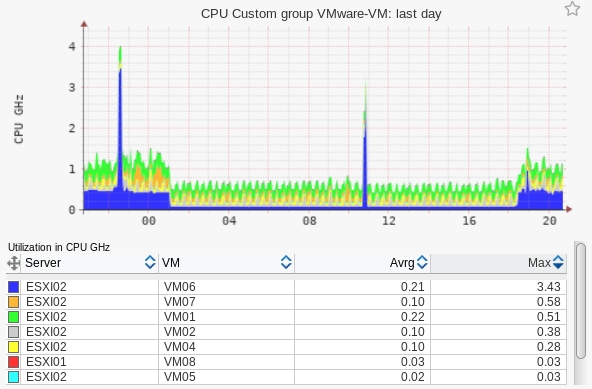 |
Typical usage
- Grouping nodes of a active/active cluster to see total CPU utilization per all cluster nodes in one graph.
- Grouping nodes of active/passive cluster it might be useful, as you get total CPU utilization together for all nodes of the cluster (active and passives) no matter which one is actually active.
- Grouping of application farms, environment landscapes (Production, testing, etc).
Grouping possibilities
-
CPU from different Servers/ESXi
- CPU pool utilization
- Memory allocation
-
VM/LPARs from different servers
- CPU utilization
- Memory allocation
- Memory utilization
- LAN throughput in MB/sec (all interfaces)
- SAN throughput in MB/sec (all interfaces)
- SAN throughput in IO per sec (all interfaces)
Examples
VIOS SAN throughput MB/sec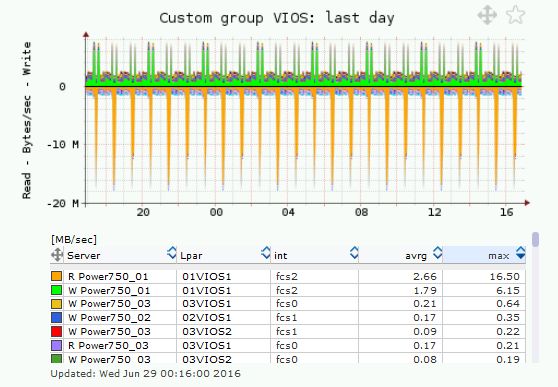 |
VIOS SAN throughput IOPS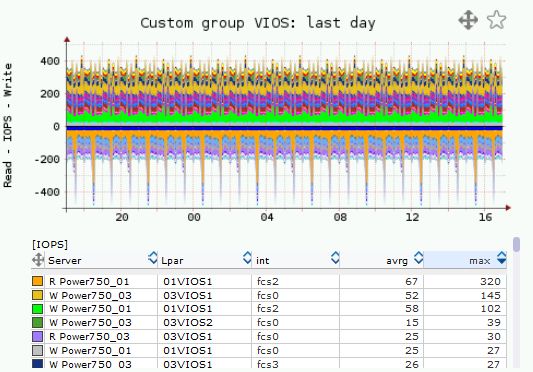 |
LPAR Memory utilization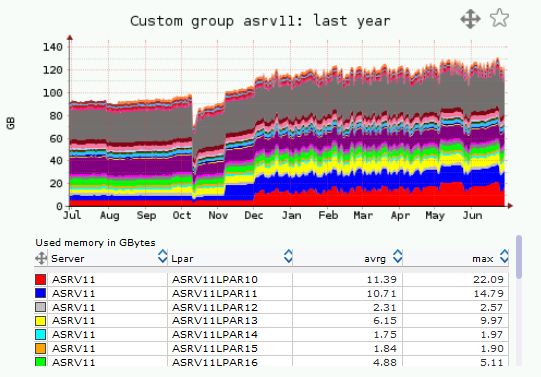 |
Further examples can be found on the product Free Demo
Custom Groups feature allows you group selected items from physically different devices (Storage/SAN switches) into one aggregated graph.
It creates these aggregated graphs:
Further examples can be found on the product demo site
Functionality is similar to historical reports, however here you can preconfigure it. Then you will get required daily-yearly graphs in 2 or 3 clicks
It is all configured from the UI
It creates these aggregated graphs:
- Storage Pools / Volumes / Hosts
- IO rate
- IO read
- IO write
- data rate
- data read
- data write
- response time total (latency)
- response time read
- response time write
- SAN ports
- data in
- data out
- frames in
- frames out
- BB credits
- errors
Examples
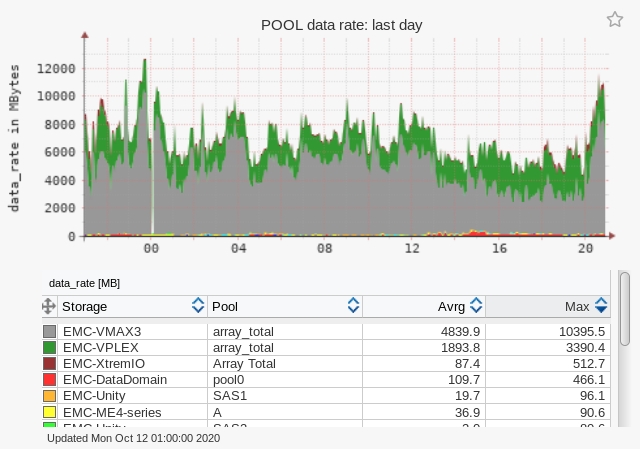 |
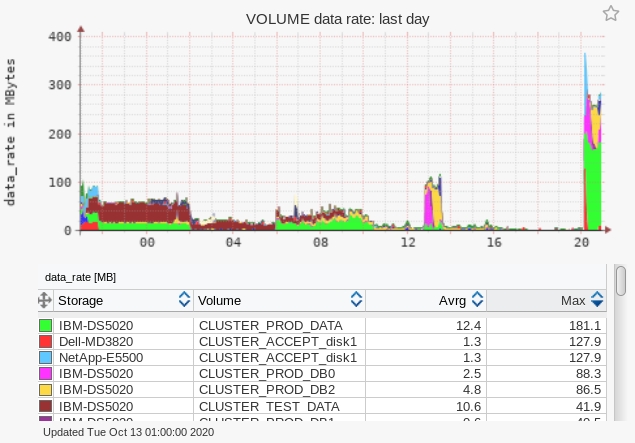 |
Further examples can be found on the product demo site
Functionality is similar to historical reports, however here you can preconfigure it. Then you will get required daily-yearly graphs in 2 or 3 clicks
It is all configured from the UI